There’s a good chance if you’ve found your way to a niche Baseball Prospectus site covering the New York Yankees, you’re in the loop with the more prominent stories over the first week of the season.
One thing that’s been the subject of much discussion is velocity. Major League Baseball has switched from PITCHf/x to Trackman for in-stadium velocity readings, returning slightly higher numbers (around 1 mph).
The reason this switch has created so much buzz early on is best attributed to two factors:
First, we love overreacting to small sample sizes. The New York Post published a column after the Yankees’ first loss of the season on the possibility that the team’s ‘terrible’ start could out of hand in a hurry. That was after 0.617% of the season elapsed. One game. When our sample of action isn’t big enough to find interesting plots and sub-plots around the league, we analyze and over analyze the juicier bits we have.
Second, it has to do with the wave of statistics encompassing the game of baseball in this era. We drool for data early in the season so we can compare it to past years and project the other 161 games with a feverish hope for accuracy. I’m not afraid to admit I function as a member of those baseball fanatics.
Velocity is the quickest metric to stabilize, meaning it’s the piece of information we can hastily use to gain valuable insight. However, if we’re using incorrect, or merely different data, we’ll be about as successful as Aaron Judge trying to fit into a child’s highchair.
So let’s see how velocity has found itself sitting with our top three starters this week against the Rays. Keep in mind, we’re not working with information that we have 100% consensus on at the moment, but BrooksBaseball, according multiple articles including this one from Fangraphs, seems to be less if at all impacted by the Trackman switch (notice “From 55ft” on the y-axis of the graphs, this relates to the switch in velocity readings now out of the hand as opposed to closer to the plate).
Masahiro Tanaka
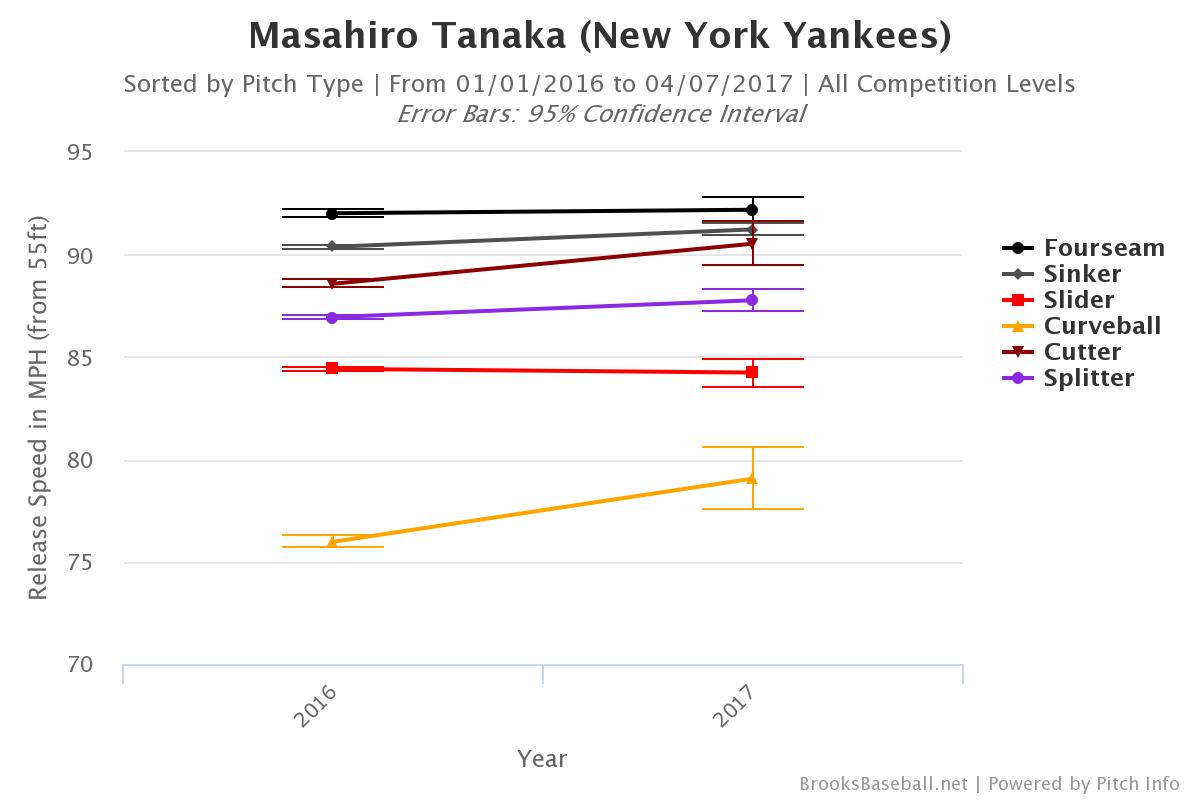
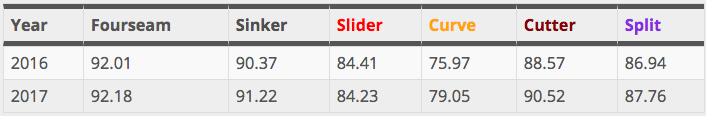
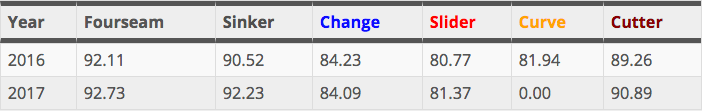
The first game of the season gets substantial television ratings, regardless of who is playing. Unfortunately, that meant a lot of the country got to see the worst of Tanaka. 67 pitches over 2 2/3 innings, yet even with what we’d normally consider half an outing’s worth of data, we can see how relatively similar Tanaka’s velocity is to the 2016 season. This is a good visualization of velocity stabilizing very quickly.
Can we infer anything from these numbers? Seeing as the Opening Day start consisted of Tanaka trying, and failing to establish his sinker early in counts, I’m fine with believing in a jump of one mph on his primary pitch. He threw his sinker 38 percent of the time on Opening Day and saw a swinging strike percentage just below 10 percent, which would eclipse the highest swinging strike percentage he had, on average, for any one month last season.
I have to admit, I’m proud of myself for actually saying something positive about Tanaka’s first start. It was after all, a glorified Spring Training outing, where he tried and failed to command his main pitch. In the process, omitting the opportunity to gain a feel for the depth of his repertoire.
Tanaka’s start Saturday against the Orioles compared to opening day didn’t really vary much in the result. Lack of command and an inability to establish his sinker, setting up his split and secondary offerings. As the season progresses we’ll have a more data to work with regarding his peripherals and are bound to revisit this open case in due time.
CC Sabathia
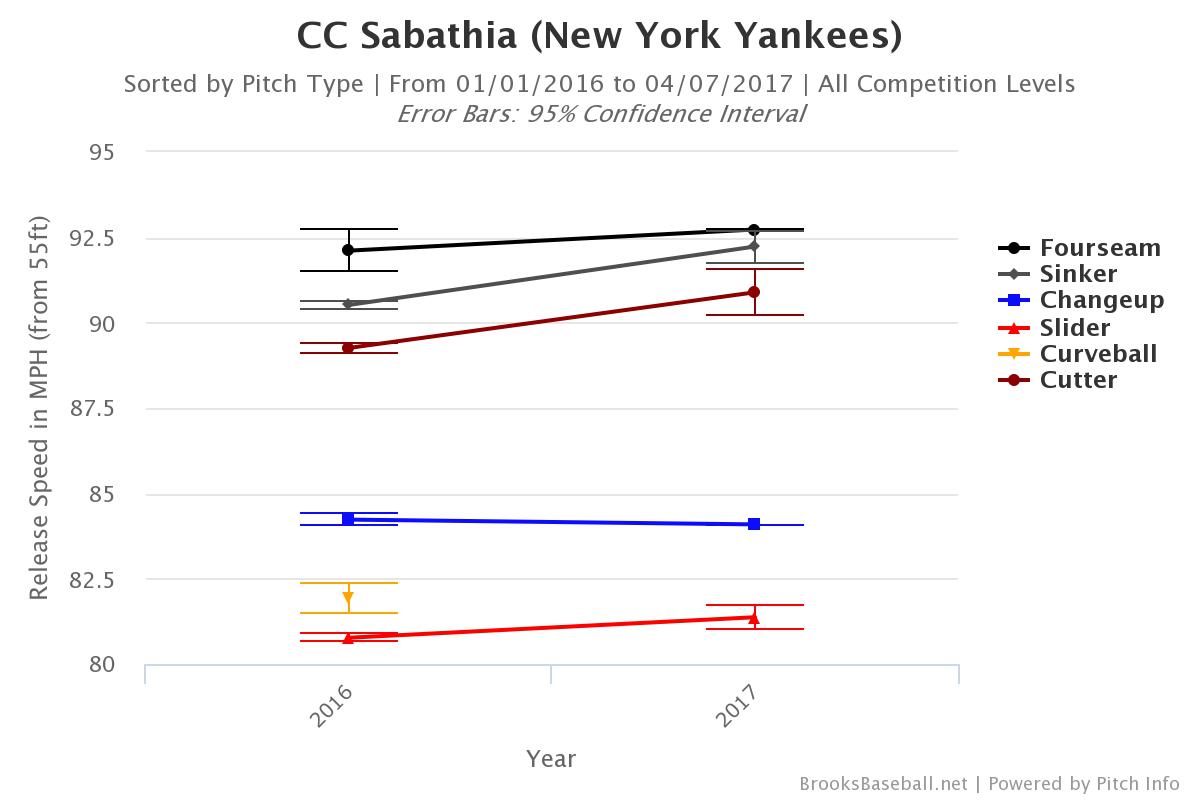
Our ageless wonder seems more and more like Bartolo Colon as every outing goes by. Eating innings and spotting pitches, but the main difference is the lack of consistent entertainment with his bat.
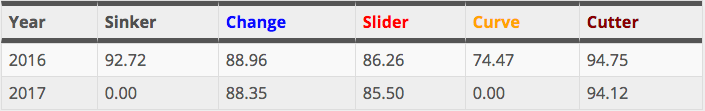
Sabathia has some noticeable upticks in his sinker and cutter velocity, both pitches he threw a combined ~60% of the time in his start Tuesday. He also substantially limited his changeup used compared to last season, making his slider the even more predominant off speed offering.
While the results were good through Sabathia’s five innings of clean baseball, it’s always tough to look at a pitcher like Pineda who only generated four swinging strikes on the 85 pitches he threw, and expect this to be the norm. A velocity uptick of any kind seems to only be a positive for a pitcher of Sabathia’s caliber, and if he can generate another batch of 165+ innings with a sub 4 ERA (like he did last year), we should be more than thrilled considering what the pessimistic projections were ballparking.
Michael Pineda

The toughest thing not to overreact to are the consistencies that we hope can change. Your mind goes through confirmation bias during the spring, seeing and hearing about a Pineda changeup, only to observe very little difference in his pitch selection.
It’s simple. Pineda doesn’t pitch to his peripherals, and after a rough start Wednesday in Tropicana, it’s ever so easy to rolls your eyes and feel a bit of deja vu.
But again, let’s caution our brevity in decision making. Pineda has nearly identical velocity from last year to this year among any of the three starters I highlight here. Even with the changeup work over the Spring, as we’ll always refer back to come the regular season, it really means nothing if he doesn’t have the confidence to throw it in game.
There is some very humorous logic with Pineda and his expectations. We all want him to be consistent. Girardi even wants him to be consistent. But what kind of consistency can we reasonably expect? If he’s consistently good, with a strikeout percentage north of 25 percent, he’s an ace caliber pitcher. At this point, that’s an outcome we can’t factor in meaningful odds for.
What we’re really asking for is toned down consistency. Fewer strikeouts, better command, fewer homers, and fewer blow up starts. That’s not nearly as attractive as the imaginable ceiling on a pitcher with this level of bat missing ability, but it’s the reality.
Pienda’s results are oddly consistent with last year, yet still bring increasing levels of disappointment. The velocity looks fine, and hopes can once again change colors quickly with a few eight-plus strikeout outings. What’s the definition of insanity again? Doing the same thing over and over, expecting different results.
Off into the Sunset…
So what’s the moral of the story with all this velocity talk?
If everybody looks like they’re throwing a few miles per hour harder than they were at the end of 2016, there may be an issue with the data as a whole. As the old adage goes, if it looks like a duck, smells like a duck, and quacks like a duck. It’s probably a duck.
We look at velocity early over other metrics because of this stabilization. It gives us concrete evidence of any alarming or encouraging change. This is why so many have been perplexed early in the season by the full switch to Trackman and the adjustment of velocity measurement. We simply want one of the most widely referenced stats for a pitcher to be consistent, without having to dive in and understand the decision to start tracking pitches at a different point on their path to home plate.
With Tanaka, Sabathia and Pineda, I strongly believe in focusing on stats like velocity early and gradually stitching in the underlying peripherals (swinging strike %, hard contact %, zone %, etc.). If velocity looks relatively stable, then we can bring in the fun stuff to intricately pick away at what may have improved or faded.
It may be very ineffective to tell anybody prone to overreacting not to overreact, but that’s exactly what I’m trying to do. Maybe we can also tell the Post to ‘chill’ with the talk of a disastrous start lingering, even with the injury concerns that seems to pour in every game.
Or at least we can wait a few more starts for the ‘disastrous’ metric to stabilize.