Typically, when we attempt to determine if a player has been lucky or unlucky we look at statistics like BABIP for hitters and pitchers. BABIP for hitters is somewhat of a skill and therefore abnormal values during a given year can be regressed to the mean to determine if that particular hitter is due for a patch of good luck or if he will go the way of Eugenio Velez and his 2011 hitless streak of 46 games. While BABIP tends to give us a back-of-the-envelope estimate of future performance it is by no means perfect. A hitter’s BABIP can suddenly and naturally re-calibrate leaving the new number as the true average on which all other future numbers should be regressed. For instance, pick any random two to three year segment of Alex Rodriguez’s career and you will get a significantly different BABIP. In a sense, using BABIP regression to uncover lucky or unlucky players works until it doesn’t.
In the spirit of BABIP and what it has taught us and continues to teach us about luck and regression, I decided to examine a slightly different way of predicting if a player may be lucky or unlucky. My method involves using two types of predictive models, k-nearest neighbors (kNN) and logit regression; both of which I am not an expert with. However, I do possess a basic understanding of how they can be applied for this exercise. The data used in these models comes from the incomplete and inconsistent batted ball data derived from the MLBAM PITCHf/x software. PITCHf/x is mainly used for the tracking and recording of pitch data, but with the roll out of Statcast now includes partial batted ball data such as exit velocity, distance, and angle.
Rob Author – of Baseball Prospectus fame – took a look last year at how well some of this new batted ball data can predict player performance. Based on his findings it would seem there is a significant correlation. Rob’s method of finding lucky and unlucky players looked at the correlation between exit velocity and a batter’s OPS. My process is similar, but looks at how well Statcast’s batted ball data can predict an actual hit. I then compared those predictions with each player’s actual result for each at bat to see if they were lucky, unlucky, or indifferent.
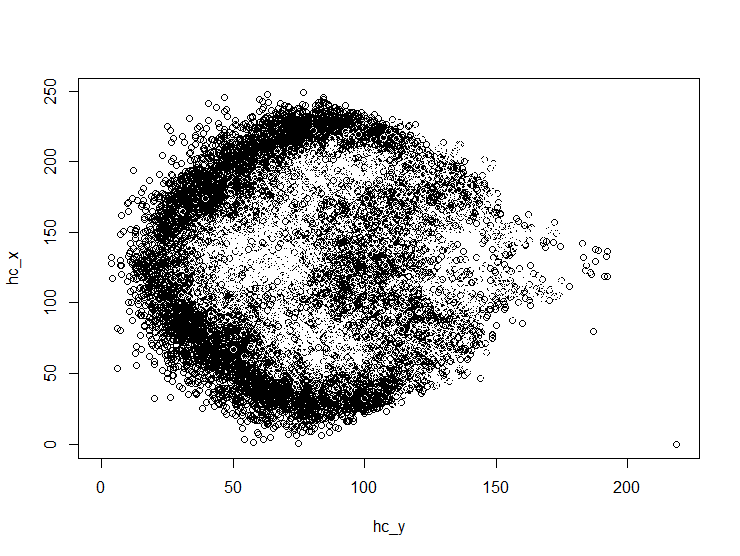
Since there is a limited amount of complete public Statcast data available I scraped together what I could which came to just over 159,000 rows for last season (2015). I chose three predictor variables based on their correlation value. These three variables – as mentioned before – are exit velocity, distance, and angle (horizontal). For my first attempt at predicting the result of the ball put in play I used the k-nearest neighbors algorithm and its handy classification feature. kNN calculates the distance between a new observation and all known points in the data set. It then ranks those distances from least to greatest and classifies the new observation based on the first k numbers ranked. Long story short, it is a machine learning technique that clusters analogous data points together and classifies those clusters. In this case we will be clustering hits based on the three independent variables.
Below is a graph showing the outcome. Notice the graph faintly resembles a baseball diamond on its side. The points are hits and as you can see the areas less clustered – where you can see white space – represents those zones where hits did not fall.
I compared the kNN classification of batted ball outcomes with the actual outcomes for each Yankee hitter’s batted ball plays in 2015. By doing this I was able to see which hitters were lucky or unlucky with getting hits. A ranking system seemed more appropriate considering the Statcast data from 2015 is limited and somewhat biased. I did not trust certain individual predictions, but put more stock into how each player ranked among one another. The table below shows us how each Yankee hitter ranks from most lucky to least lucky.
| Yankee Batters Luck Level by Batted Ball Data (kNN) | |||
|---|---|---|---|
| Player | |||
| Lucky | Didi Gregorius | ||
| Carlos Beltran | |||
| Brian McCann | |||
| Jacoby Ellsbury | |||
| Starlin Castro | |||
| Dustin Ackley | |||
| Alex Rodriguez | |||
| Mark Teixeira | |||
| Aaron Hicks | |||
| Chase Headley | |||
| Unlucky | Brett Gardner | ||
The kNN model was found to be around 40 – 60 percent accurate and while this is not ideal it seemed to be appropriate considering some of the biases in the data set. However, to be on the safe side I used a more common follow up approach to predicting binary outcomes. Logit regression is quick and easy and gives us the predictive probability of the batted ball going for a hit. Once again the three independent variables used where exit velocity, distance, and horizontal angle. The forecasted probabilities of each batted ball going for a hit where compared to the mean probability for all outs and all hits. Doing this allowed me to see under and over achievers much the same way the kNN algorithm classified batted ball outcomes.
The table below shows the ranking of all Yankee hitters from most lucky to least lucky based on the results of the logit regression comparison.
| Yankee Batters Luck Level by Batted Ball Data (Logit) | |||
|---|---|---|---|
| Player | |||
| Lucky | Didi Gregorius | ||
| Chase Headley | |||
| Starlin Castro | |||
| Carlos Beltran | |||
| Brian McCann | |||
| Mark Teixeira | |||
| Alex Rodriguez | |||
| Jacoby Ellsbury | |||
| Brett Gardner | |||
| Dustin Ackley | |||
| Unlucky | Aaron Hicks | ||
If you compare the two charts above they are not identical, but there are some similarities. If you split both lists of Yankee hitters into two buckets you find that each hitter falls into the same bucket on both charts with the exception of Jacoby Ellsbury and Chase Headley. This discrepancy is not surprising considering the data is less than perfect. However, for the most part we can see that there may be something to be said for determining possible regression candidates based on batted ball data.
| Lucky | Unlucky | Unknown |
|---|---|---|
| Didi Gregorius | Dustin Ackley | Chase Headley |
| Carlos Beltran | Alex Rodriguez | Jacoby Ellsbury |
| Brian McCann | Mark Teixeira | |
| Starlin Castro | Aaron Hicks | |
| Brett Gardner |
This year I will be keeping my eye on guys like Didi Gregorius and Carlos Beltran. If they cannot increase their exit velocity, they may have trouble finding as many holes as they did last season. On the flip side, Aaron Hicks and Brett Gardner may see a slight uptick in performance from last year. It seems that MLBAM is releasing more comprehensive batted ball data by way of their Statcast technology. I will keep my eye on this list as the season goes on and will update everyone with the new data later in the season.
Note: Ronald Torreyes and Austin Romine were not included because they did not have enough 2015 batted ball data.
Lead photo: Andy Martin / USA Today Sports