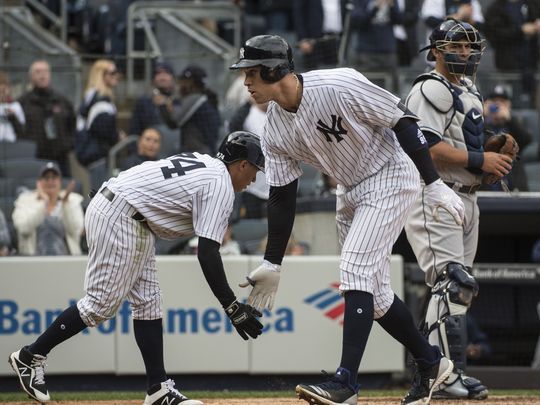
It’s 2018 and you are an informed consumer of baseball knowledge. As such, you most likely already know about the three true outcomes- home runs, walks, and strikeouts- and why they are important. They are the only three major outcomes of a plate appearance that have nothing to do with defense and are almost entirely controlled by the pitcher and the batter. These three stats are pretty good indicators of future success for both pitchers and batters.
As it turns out, the Yankees are really good at these things. Their pitchers AND hitters are the among best in baseball at generating positive three true outcome (TTO) results. Let’s check the team leaderboards for each TTO stat through Saturday’s action.
Home Runs
| HR-offense | HR-pitching |
HR offense – HR pitching (Net HR)
|
|||
| LAA | 15 | SFG | 2 | SFG | 8 |
| CHW | 14 | 4 teams | 4 | CHW | 7 |
| NYY | 13 | NYY (18th) | 10 | MIN | 6 |
| 4 other teams | 13 | STL | 6 | ||
| NYY (7th) | 3 |
The Yankees’ big bats are only just getting started, but they’re already third in MLB in HR, two off the lead. They hit 241 of them last year and then traded for Giancarlo Stanton, so they ought to be at or near the front of the pack all season. Their pitching staff is roughly average at HR prevention, having yielded 10 thus far. Their net total is +3, good for 7th in baseball.
There are other factors here, of course. Each team has only played 7-10 games so far (the Yankees have played 9), so there are small sample size considerations. Park factors vary greatly and are probably a big reason why the Giants pitching staff has only given up a pair of long balls all year. Early April weather is a major variable as well. Still, the Yankees are a net positive, and that’s a very good thing when we’re talking about the most game-altering event possible in any plate appearance.
Walks
| BB-offense | BB-pitching |
BB offense – BB pitching (Net BB)
|
|||
| NYY | 43 | KCR | 19 | OAK | 20 |
| ARI | 43 | OAK | 20 | ARI | 19 |
| WSN | 42 | CLE | 20 | WSN | 16 |
| OAK | 40 | DET | 21 | HOU | 15 |
| CHC | 39 | NYY (15th) | 29 | NYY | 14 |
Yankee hitters are the most patient in the league (tied with Arizona), leading the way with 43 walks. Shockingly, Didi Gregorius leads the team with 8 after collecting only 25 free passes in all of 2017. The pitching staff is middle of the road, sitting 15th in MLB with 29 walks allowed. Altogether, they have a net +14 walks, 5th best in MLB.
Strikeouts
| K-offense | K-pitching |
K pitching – K offense*
(Net K)
|
|||
| KCR | 32 | NYY | 104 | BOS | 29 |
| PIT | 50 | HOU | 97 | NYY | 27 |
| BOS | 50 | TEX | 90 | NYM | 26 |
| DET | 52 | ARI | 86 | ATL | 20 |
| NYY (20th) | 77 | LAA | 83 | LAA | 19 |
Here’s where the pitchers shine. The home run hitters are usually strikeout prone, and Stanton and Judge have 26 already. However, the pitching staff is the best in baseball at inducing Ks. Chad Green and Aroldis Chapman have struck out 19 of the 37 batters they’ve faced! Their net +27 strikeouts are second only to Boston
*-Net K is reversed from net HR and net BB because K is good for the pitcher while the other two are good for the offense.
Put it All Together
There’s really a fourth true outcome, HBP, that has the same impact as walks. It doesn’t happen that often, but it’s a true outcome all the same because only the pitcher and the batter can control it. Combining all four of these net outcomes, the 2018 leaders look like this:
|
Net TTO Totals
|
|
| NYY | 46 |
| NYM | 41 |
| BOS | 39 |
| WSN | 34 |
| HOU | 28 |
The Yankees, while not being the net leader in any one of the TTO categories, have a healthy advantage over the rest of baseball in combined net TTO. This passes the sniff test, as the top 5 teams on this leaderboard are 29-12 this season.
However, not all of these outcomes have an equal weight. Homers and walks are both good outcomes for the batter, but a home run is REALLY good while a walk is just a little good. Knowing this, the creators of FIP assigned weights to each outcome to accurately reflect their impact on a game. We’ll borrow from the FIP formula to weigh our TTO leaderboard as well:
wTTO = (Net HR*13) + (Net (BB+HBP)*3) + (Net K*2)
| wTTO | |
| NYY | 141 |
| BOS | 118 |
| WSN | 118 |
| NYM | 87 |
| HOU | 83 |
The same teams comprise the top 5, but the order is jumbled a bit. The Yankees are still out in front, and their lead looks much more impressive. Given their level of talent, they should be able to stay near the front of the league all season, and the wins will surely follow.
