Arizona will store its game baseballs in a humidor for the 2018 season. Phoenix has a dry desert climate, resulting in dry baseballs. Dry baseballs will have a higher exit velocity, due both to a lower mass and more springiness. As a result, Arizona had an offensive environment that strongly favored offense for its first two decades of exsistence.
The humidor discussion forced me to think about park factors. A ton of factors can influence offense at a ballpark. Field dimensions can change a home run into an out, increase the probability of a foul pop up, or make it easier for an outfielder to cut off a double. Wind can blow batted balls in any given direction. Elevation can decrease air pressure, allowing balls to travel farther. Humidity can deaden or liven a ball. A batter’s eye can make it easier for hitters to catch spin.
We can lump all of these factors into two groups: things that affect batted balls at contact, and things that affect batted balls after contact. Arizona’s dry air and Detroit’s great batter’s eye affects the ball at contact. Fenway’s Green Monster and Colorado’s low air pressure affect batted balls after contact.
We can analyze these two different groups using data from Statcast. Before contact and at the moment of contact, Statcast measures the exit velocity and launch angle of the ball, folds in strikeout, walk, and hit by pitch rate, and assigns an expected weighted on-base average (xwOBA) to a batter or group of batters. If we subtract a team’s home xwOBA from its road xwOBA, we can estimate the average “at contact” park factor for a team.
After the moment of contact, there are batted ball outcomes. A 100mph, 18-degree launch angle batted ball becomes a hit or out. Batters accumulate a wOBA based on these outcomes. Statcast subtracts a batter’s wOBA from his xwOBA to produce an expected – observed value, which tells us about the batter’s batted ball luck. If we further subtract the batter’s batted ball luck at home from batted ball luck on the road, we can estimate the “after contact” park factor for a team.
Add “after contact” and “at-contact” together, and you get a traditional park factor (which is strongly correlated at .81, although there is room for other factors such as batters intentionally pulling balls toward the Yankee Stadium’s short porch):
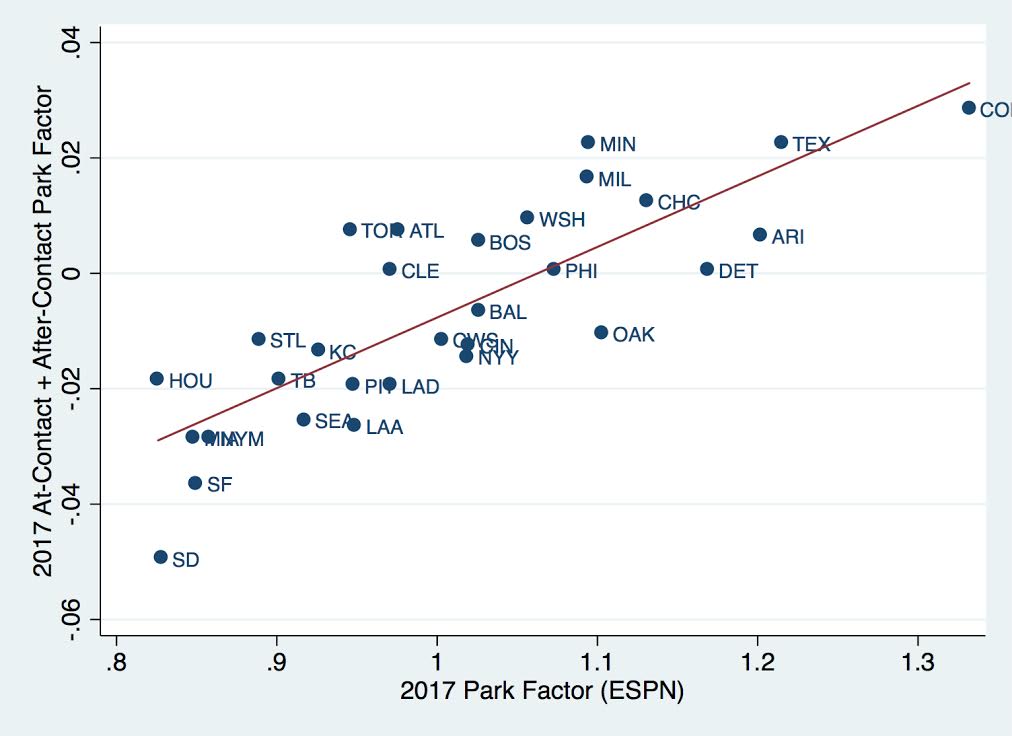
We see here that the Statcast data do a good job of predicting most ballparks, although with a few interesting deviant cases in Oakland, San Diego, and Toronto. Oakland can be explained by the increased foul area, but your guess is as good as mine for the others. The model nails Yankee Stadium, despite the odd short porch, pretty well.
That’s kind of boring though. Instead, we can graph the “at contact” and “after-contact” rates against each other, and observe the different dimensions of park factors:
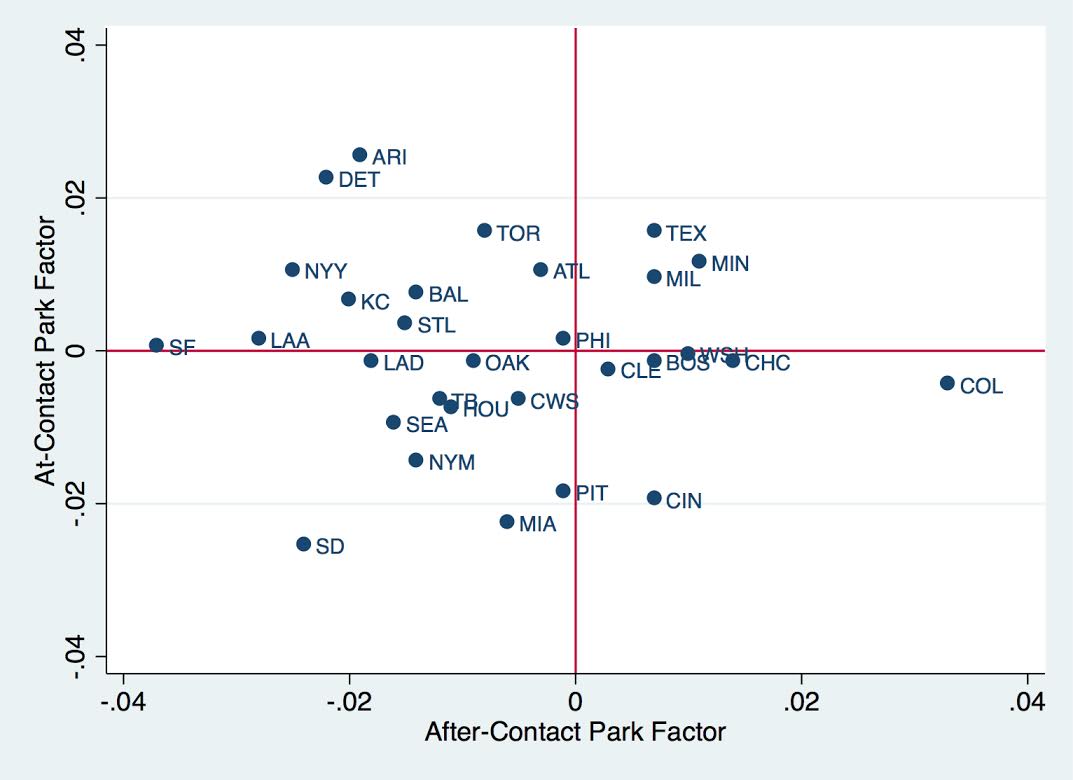
Note: I’ve normalized xwOBA to average to zero. All park data is from 2017.
Let’s go quadrant-by-quadrant:
In the bottom-left quadrant, we have parks with both below-average park factor at-contact and after-contact. These are your true pitcher’s parks. San Diego is the big outlier, with strong scores in both categories. Other ballparks in the quadrant aren’t surprising either: Miami, Citi Field, and Seattle are all well-known pitchers parks.
In the top-left, we have ballparks with an above-average at-contact park factor, but a below-average after-contact park factor. Some of these are obvious: Arizona has its dry air, Detroit has it’s great batter’s eye but huge outfield, etc. Yankee fans may be surprised to see Yankee Stadium here, but I am not. While Yankee Stadium has a huge park factor for home runs, it was a pretty average ballpark overall in 2017. All of those home runs gained by the short porch in right field are offset by a fairly easy right field for an outfielder to cover. San Francisco is really interesting here too – the ballpark has an almost perfectly average at-contact park factor but by far the worst after-contact park factor in the game.
In the bottom-right, we have ballparks where the at-contact park factor is below average, but the after-contact park factor is above-average. Colorado is the obviously interesting team here. Colorado does not have a strong park factor before contact, probably due to its humidor-stored balls, but the park’s huge outfield and low air pressure result in a giant after-contact park factor.
Finally, in the top-right, we have three teams with slightly above average at-contact and after-contact park factors. These are hitters parks, although the park designers were careful not to make them too extreme.
What about Arizona and the humidor? This graph suggests that Arizona could become a pitcher’s park in 2017. Arizona currently has the highest at-contact park factor. This may be caused by a lot of things, although presumably, the dry air is the primary factor. If Arizona brings down its at-contact park factor to zero, it should play as a pitcher’s park.
Photo credit: Wikimedia Commons