It’s not the awe-inspiring “breaking” we’ve seen from Miguel Sano as he snapped his bat like a twig in 2016. Or the much more humorous attempt at breaking that we’ve seen from the likes of Yasiel Puig, seeking, and failing to accomplish the same feat. This breaking is much more subtle, a metaphor for confusion that emerges when something just doesn’t feel right. The protagonist of this escapade does something I’ve never seen, in a way that makes me doubt the effectiveness of forward-thinking projection systems, which utilize history to present a case for the future. Aaron Judge is the protagonist; the distance and velocity with which he powers baseballs is the unprecedented.
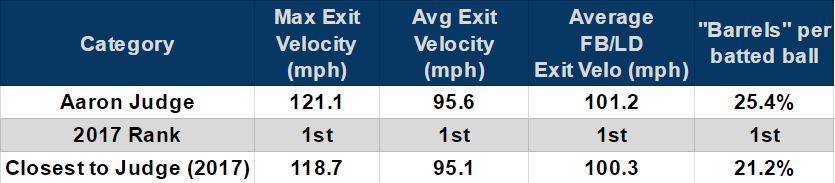
Judge has the hardest hit ball of the Statcast era, the longest home run of the season, the most home runs in the majors, everything in that chart above; the list goes on and on. Yet two of the more widely referenced stats when it comes to regression – HR/FB% and particularly BABIP – currently hold Judge well above the rest of the pack. His BABIP is .420 (26 points higher than Miguel Sano, second highest), with a HR/FB% of 41.3% (8.4% higher than Cody Bellinger, second best) heading into Tuesday night’s action.
It may seem irrational, but for one of the first times in my memory, I’m heavily perplexed by how much I should put in projection systems looking towards what Aaron Judge will do by season’s end. Boiling this argument down to the most rudimentary, non-statistical language I can; if we haven’t seen Judge’s batted-ball accomplishments before, how are we to believe that a projection system of historical data, can effectively factor in the feats in guesses at Judge’s average or slugging percentage? If it believes in the smoothing of perceived “outliers,” what happens if the 6’7″ Judge is simply going to hit baseballs this far and hard for the rest of the season, and perhaps, his career?
As we understand it, exit velocity stabilizes relatively quick for hitters, reliable over 70% after 50 batted ball events – Judge has 169 of such events. In 2016, we saw only one player above 95 mph in terms of average exit velocity. That individual was a free swinging, strikeout-prone player by the name of… Aaron Judge. The closest two samples we have to Judge’s 2017 exit velocity since 2015 are Giancarlo Stanton in 2015 (95.9 mph) and Miguel Sano this season (95.1 mph) — via Baseball Savant. While Stanton and Sano have already achieved unbelievable heights in the exit velocity stratosphere, Judge has done so with an advanced ability to barrel-up baseballs — 5% more than Sano (2017); 1% more than Stanton (2015) — and connect for line drives – roughly 5% more than both Sano (2017) and Stanton (2015). What do we know about line drives? They result in a hit about three times more often than either a fly ball or ground ball. Implying, to some extent, that the crazy high BABIP Judge carries at .420, still has time to come down, but nearly 100 points to the projected .325 level I’ve seen in the industry feels like that “breaking” I talked about way back in paragraph one.
Players with Judge’s 2017 projected .325 BABIP last season include the following…
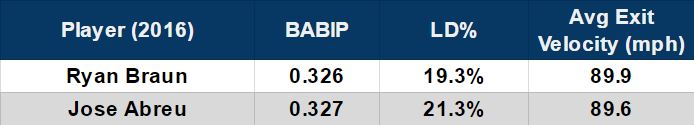
By now you can instinctively see the difference between Ryan Braun and Jose Abreu, compared to Aaron Judge. The homegrown Yankee talent hits the ball substantially harder and produces more line drives than Braun and Abreu. So why the low BABIP?
It could stem from the one inherent flaw in my optimism regarding Judge; line drive rates take more than a year and a half to stabilize, and we’ve only seen around 300 plate appearances of Judge. Given that in 2016, Judge had a line drive rate of 14% through his very unproductive 95 plate appearances, there is concern that Judge won’t be able to maintain an elite, top-10 BABIP in the league. Contrary is that we’ve heard numerous times Judge is a different hitter. Giving us confidence that reliance on 2016’s now tiny sample isn’t the most astute thing to do. If we take a look at players with over the last three seasons with at least 1500 plate appearances and a BABIP of .350 or better, the 11 names are present through a mix of distinct factors. Six are elite talents: Paul Goldschmidt, J.D. Martinez, Joey Votto, Mike Trout, Miguel Cabrera, Freddie Freeman. Three rely on their legs: Starling Marte, Dee Gordon, Lorenzo Cain. One plays in Coors (DJ LeMahieu), and the last is Christian Yelich.
If I split the difference between Judge’s current BABIP and projected BABIP, I’m left with a .373 number that would exceed Paul Goldschmidt’s league-leading .369 from our three year stretch of 2014 to 2016. While it’s easier to bet against this feat over the next two and a half years, an argument in favor of a .370+ BABIP’s possibility hinges on Judge’s exit velocity being legitimate, and the stabilization of his line drive rate around its present 25% mark. Then, I’d have to worry about the other two factors BABIP is notorious for considering, luck and defense, both out of Judge’s control.
All this talk about BABIP and whether Judge can maintain it at an elite level plays into the expectations for his end of season line.
Let’s remind ourselves of what Judge has done to this point in the season and what Baseball Prospectus’ PECOTA is thinking might follow suit.
Through June 26th – 26 HR, 59 RBI, .330/.443/.693, 3.8 WARP
PECOTA 50th Percentile, Rest of Season – 16 HR, 48 RBI, .251/.343/.470, 2.2 WARP
PECOTA 90th Percentile, Rest of Season – 21 HR, 64 RBI, .291/.389/.545, 4.3 WARP
Am I betting that Judge’s .330 average continues for the rest of the season? No, but I’m not betting on a .251 average either, even with his swing-and-miss tendencies. I wouldn’t consider a BABIP in the .360-.370 window out of the question, which means independent of a change in luck and defense, Judge’s average can realistically sit in the .280-.290 window without the sky falling. This average is more in line with the 90th percentile projection, but my confidence in his batted ball profile and exit velocity plateauing, with even a minor drop, is more optimistic than any projection system is willing to assume.
I’m more than excited to compare Judge’s rest of season projection above, to what actually occurs from June 27th to October 1st. Maybe Judge is a flash in the pan, or maybe he’s bound to be the Anti-Michael Pineda. Outperforming peripherals and soaking up all the glory that comes with it.