
For the past two seasons — over at the Effectively Wild Podcast sister site Banished to the Pen — I have attempted to evaluate the performance of general managers and their baseball operations department. It occurred to me that there are some basic economic principles that would allow us to better understand how effective each club’s front office has been with regards to the transactions they make. For example, I used the concept of “economic profit” to create a new variation of WARP that looks at the impacts, both real and potential, of acquisitions and departures.
Last season I took a stab at implementing this model of evaluation based on preseason projections. I then compared the metrics built from the projected stats to the ones calculated at the end of the season. Once again I will be evaluating front office transactions based on forecasted stats for the 2016 season. This year I am using PECOTA preseason projections. In this post, I will briefly introduce this rating system and then analyze where Brian Cashman and company fall on the list and why.
Evaluating All Front Offices
There are two economic principles that I used to evaluate front offices. As mentioned earlier, I used economic profit to evaluate the lost opportunity cost of players traded, released or in some way removed from the team. I dubbed this new calculation eWARP. Gross domestic product – the second economic measure used – was altered to fit the model of a major-league baseball organization. Out of that statistic came gross domestic wins (GDW). GDW allows us to isolate the transactions made by general managers even more so than eWARP. It allows us to compare the players a club acquires versus the ones they let go in the context of WARP. In this exercise, WARP is used as a form of currency in place of dollars. For a better understanding of this system I suggest reading the primer over at Banished to the Pen.
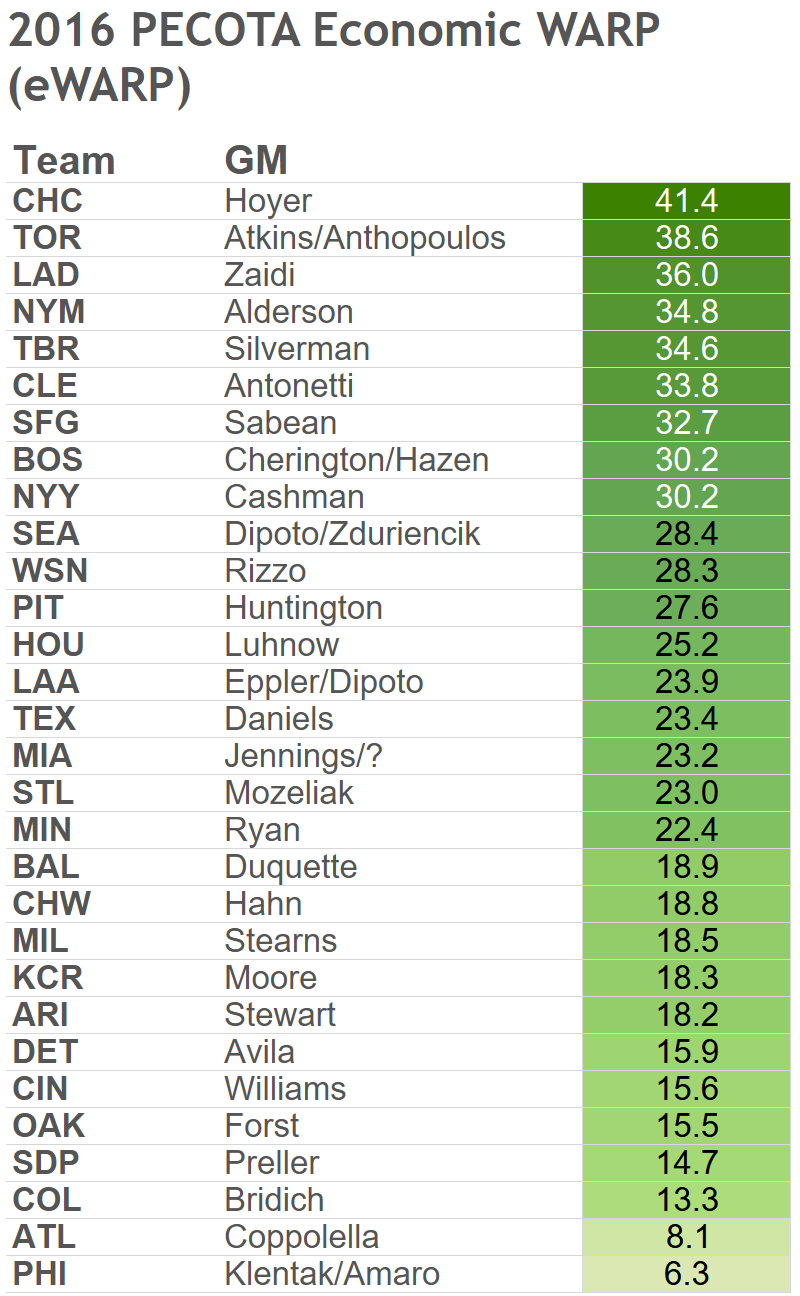
Below are the 2016 major-league front office preseason rankings based on eWARP. Remember, eWARP factors in the lost opportunity cost of player departures.
eWARP = Total Team WARP – WARP of Players Exported from the Team
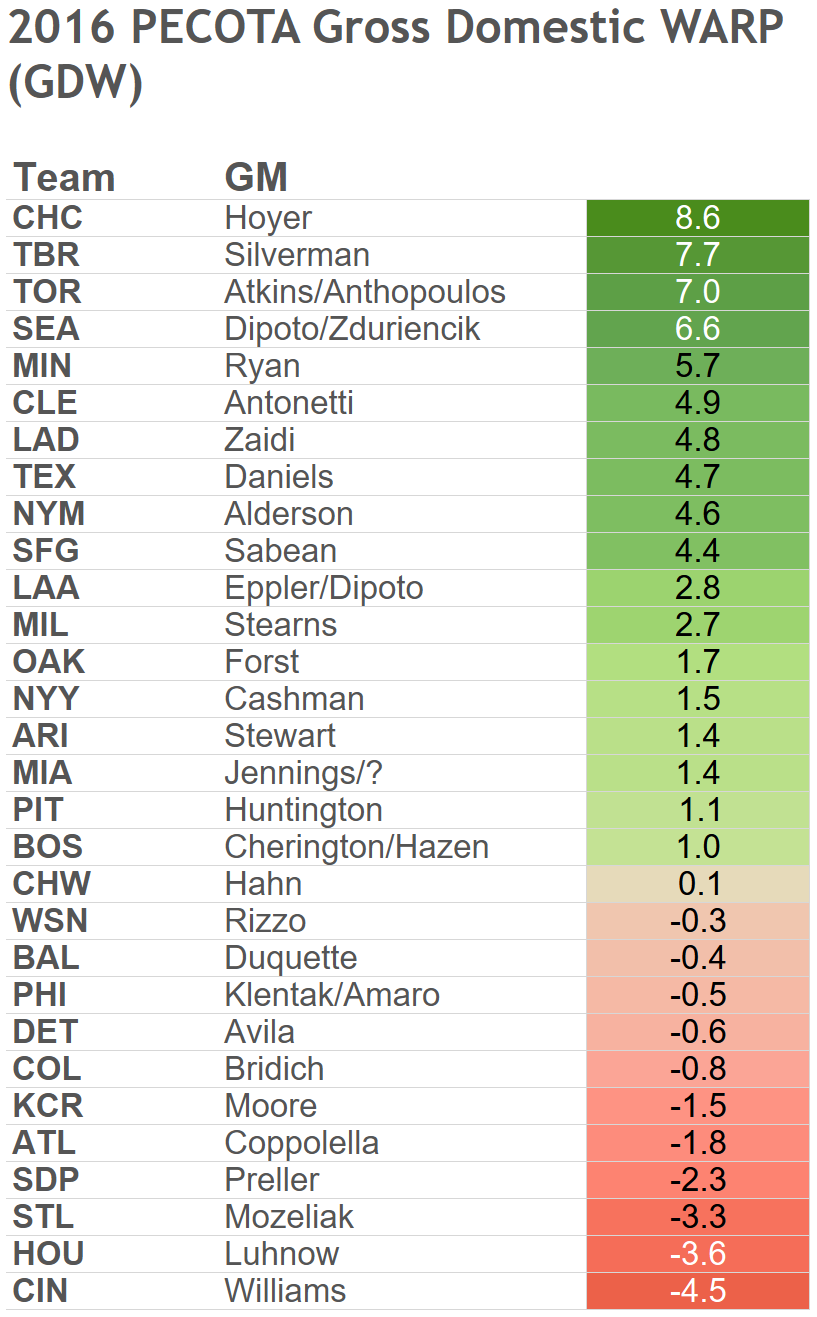
The next chart looks at GDW. Gross domestic wins – in my opinion – is a more accurate assessment of front office performance. This stat pinpoints and compares the acquisitions, departures and call-ups of major-league teams.
AvgGDW = Average WARPcallups + (Average WARPimports – Average WARPexports)
The Yankees land around the middle of the pack on both of these lists. They perform somewhat better with respect to eWARP which indicates a majority of their production is projected to come from their returning players. It also shows the players they removed from their team, collectively are estimated to have a less than stellar season. The eWARP rankings will resemble the overall preseason PECOTA rankings due to the fact total team WARP is used as the number for which all exported players projected wins are subtracted. Naturally, the order should be somewhat the same. Things get interesting when looking at segments of the list. For example, PECOTA projects the Astros will end the season with the same total WARP as the Yankees with 33.5. However, Houston ranks below New York on the eWARP list. Houston gave away several guys that PECOTA is somewhat high on for the 2016 season meaning they have a high lost opportunity cost which in turn gives them a lower economic WARP.
Evaluating the Yankees Front Office Performance
I just mentioned that the Yankees will get a majority of their production – including total team WARP – from returning players. This can be seen by looking at eWARP which is calculated by subtracting the WARP of exported players from total WARP. Let’s break down these variables for the Yankees. As stated in the primer, minor league players who do not have PECOTA projections are not included in these values. This is a flaw of the system, but it is hard to project minor league players.
Yankees PECOTA Projected Preseason WARP: 33.5
Yankees PECOTA Projected Preseason WARP of Exported Players: 3.3
Yankees Front Office PECOTA eWARP: 30.2
MLB eWARP rank: 9th
| Yankees PECOTA Projected Preseason WARP of Exported Players | |||
|---|---|---|---|
| Player | New Team | WARP | |
| Adam Warren | Cubs | 0.7 | |
| Andrew Bailey | Phillies | 0.1 | |
| Caleb Cotham | Reds | 0.2 | |
| Chris Capuano | Brewers | 0.5 | |
| Jose Pirela | Padres | 0.5 | |
| Jose Ramirez | Braves | 0.3 | |
| Justin Wilson | Tigers | 0.6 | |
| Ramon Flores | Brewers | 0.5 | |
| Stephen Drew | Nationals | -0.1 | |
Not one person on the list of exported Yankee players are projected by PECOTA to produce a ton of value this season. This is a good thing. You want the organization to remove players who are projected to do worse than the players they kept. It would be a little suspicious if this list was full of three to four win players. That being said, in some cases it would make sense to see high win players on the list such as when and if the Yankees have to rebuild.
When we take a look at the gross domestic wins table we see that the Yankees do not fare as well. Refer to the GDW formula above when looking at the following stats.
Yankees PECOTA Projected Preseason WARP of Call-ups: 0.4
Yankees PECOTA Projected Preseason WARP of Imported Players: 4.0
Yankees PECOTA Projected Preseason WARP of Exported Players: 3.3
Yankees Front Office PECOTA GDW: 1.1
MLB eWARP rank: 14th
| Yankees PECOTA Projected Preseason WARP of Call-ups | |||
|---|---|---|---|
| Player | WARP | ||
| Aaron Judge | 0.1 | ||
| Luis Cessa | 0.2 | ||
| John Barbato | 0.1 | ||
| Yankees PECOTA Projected Preseason WARP of Imported Players | |||
|---|---|---|---|
| Player | WARP | ||
| Starlin Castro | 2.3 | ||
| Aaron Hicks | 0.3 | ||
| Pete Kozma | 0.1 | ||
| Ronald Torreyes | -0.1 | ||
| Aroldis Chapman | 1.1 | ||
| Kirby Yates | 0.2 | ||
| Tyler Olson | 0.1 | ||
These tables above show the breakdown of projected WARP for each Yankee call-up and imported player. You will notice two of the three call-ups are already with the big-league club. I determined this list by running a query of players who did not play at the major league level last season and who had projected PECOTA stats. There could be other players pop up on this list in the final GDW tables at the end of the season.
Considering the Yankees are looking for a major portion of their production to come from returning players, it is really only important that the Yankees have a positive GDW. The same is true when analyzing other teams’ values. The highlight tables at the towards the top of the page are ranked, but in all reality this should only be used to compare teams in similar situations.
Toronto and Tampa Bay – two division rivals – rank ahead of New York on the list. The reason Toronto is ranked high on the GDW chart is mainly because of Troy Tulowitzki. The GDW variable “imports” includes players that were acquired in the second half of last season such as Tulo. Toronto does have some other imports like J.A. Happ that project to have a decent year, but PECOTA projects next to nothing from their call-ups.
Tampa Bay simply had a great off-season at least according to PECOTA. Their imports are projected to have a great season and PECOTA projects that their rookies/call-ups are going to contribute just under two wins this season which is above league average in that category.
PECOTA has the Yankees behind the Blue Jays, Rays and Red Sox with regard to total WARP. However, when we look at GDW the Yankees are slightly ahead of the Red Sox. The main reason for this is PECOTA liking the players Boston removed from the team; guys like Wade Miley. The high value PECOTA put on Boston’s exports led them to having a slightly lower GDW than New York even with imports such as David Price.
New York’s baseball operations department are under some financial constraints from a few big contracts therefore must look to returning players for production. It would be different if you could treat these poor contracts as a sunk cost and just get rid of them, but it is unlikely that they could find a team willing to take them on. GDW and PECOTA shows that the moves they did make were actually pretty good. They got rid of players PECOTA doesn’t like and brought on players that PECOTA likes. The mean WARP of Yankee imports is .45 and .32 for exports.
This has been an attempt to use projected stats to evaluate the moves the Yankees and other clubs have made prior to the 2016 season. Once the season is over we can use final stats to evaluate the same transactions and compare those to the PECOTA preseason numbers. Last season, the end-of-season front office rankings were somewhat accurate considering a good number of playoff teams were at the top of the rankings. The preseason stats – when compared to the final results – proved to be less accurate last season so take the above analysis with a grain of salt.
Lead photo: Butch Dill / USA Today Sports